The Monthly Financial Update gives our readers an inside look at the allocation and performance of our investment portfolio. At the beginning of each month, we share a snapshot of our investments and highlight their performance over the previous month. In addition, we compute our progress towards achieving our retirement number.
History Repeats
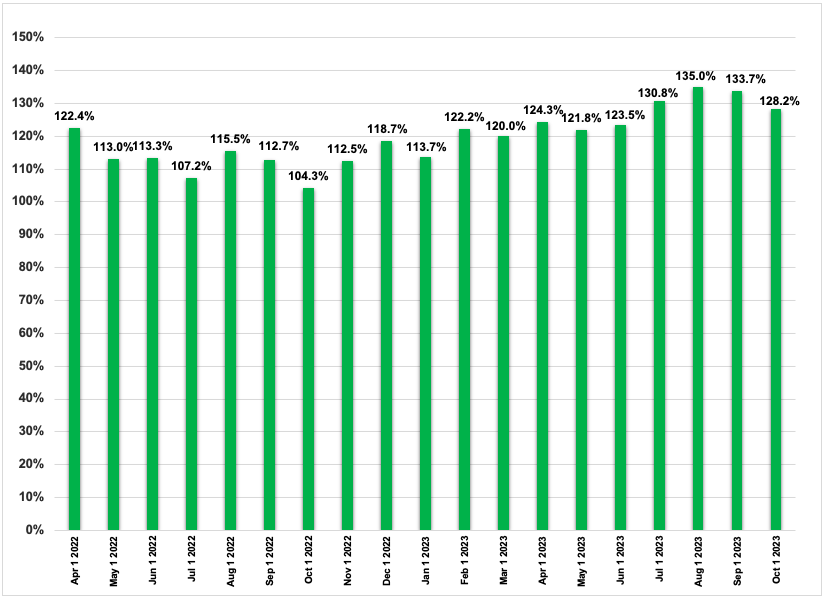
It’s been exactly one year since our last back-to-back monthly decline. Unfortunately, here we are again. Looking back at the past few years, I must say that there seems to be some truth to the idea that September is the worst-performing month for the stock market. Whether it’s 1 year ago, 2 years ago, or even 3 years ago, every September is seemingly accompanied by a drop in the value of our portfolio. On the bright side, if this is the worst month, by definition there’s nowhere to go but up!
Results:
-4.11% month-over-month growth
128.2% of retirement number saved
Check out our detailed performance in the table below.
The Numbers
Accounts Portfolio Allocation Change In Value
(September-October)
Liquid Funds 0.22% +10.51%
High-Yield Savings 9.69% +3.63%
REITs 0.29% -2.49%
401(k)s 40.37% -4.39%
IRAs 5.04% -5.02%
HSA 2.01% -3.67%
Cryptocurrencies 0.03% +4.83%
Taxable Stock Investments 39.93% -5.84%
Home Equity 3.17% N/A
Debt 0.25% -32.37%
Total = 100%
Portfolio Allocation = Current asset distribution of our portfolio
Change In Value = Change in account value due to asset appreciation/depreciation, deposits, and withdrawals
Tools To Get You Started
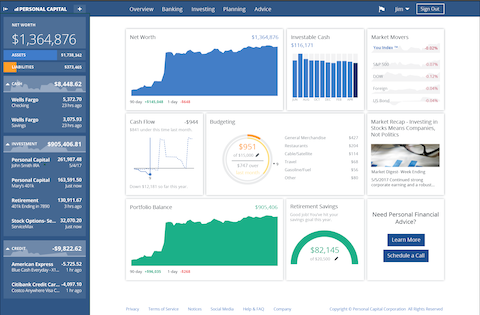
Get a head start on your journey toward achieving financial independence by analyzing and tracking your income, expenses, investment performance, and overall net worth with the free online wealth management tool Empower Personal Dashboard.
We use Empower Personal Dashboard regularly to analyze our investment fees, track our investments, and project our net worth. We also periodically review our progress toward retirement with their retirement planning calculator.
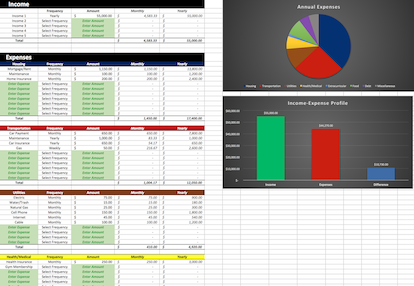
If you’d rather do things on your own, become a subscriber today and you’ll receive our Free Financial Planning Dashboard. This tool allows you to enter your income and expenses to create a detailed budget. You can use it to track your spending habits over time or just to get an idea of where your money is going each month. Take a look at the automatically generated charts and you may discover you have a little more cash to invest than you thought.
If you’re interested in detailed instructions on how to budget, save, pay off debt, and invest, check out The 6 Phases of Building Wealth. This book provides step-by-step instructions for working through each “Phase” in the process of achieving Financial Freedom. If you're just starting out, the information in this book will provide you with an invaluable resource. You can pick up the digital version for only $2.99 on Amazon.
Disclosure: Some of the links found on this website may be affiliate links. Affiliate links pay GGD a small commission when you click through and/or make a purchase. This is at zero additional cost to you.
Full Disclaimer/Disclosure
Related Posts
-
Monthly Financial Update - October 1, 2018
The Monthly Financial Update gives our readers an inside look at the allocation and performance of our personal portfolio. At the beginning of each month, we share a snapshot of our investments and highlight their…
-
Budgets Are Hard: How We Manage Our Finances Without One
Read almost any financial self-help book, blog, or article and one of the first recommendations will most likely be to create a budget. The authors will say things like, “Having a detailed budget is one…
-
Cutting Expenses Is More Effective Than Increasing Income
Just about everyone strives to increase their income over time. The more we make, the more secure we feel. When it comes to achieving financial independence, however, making more money is not always the most…


