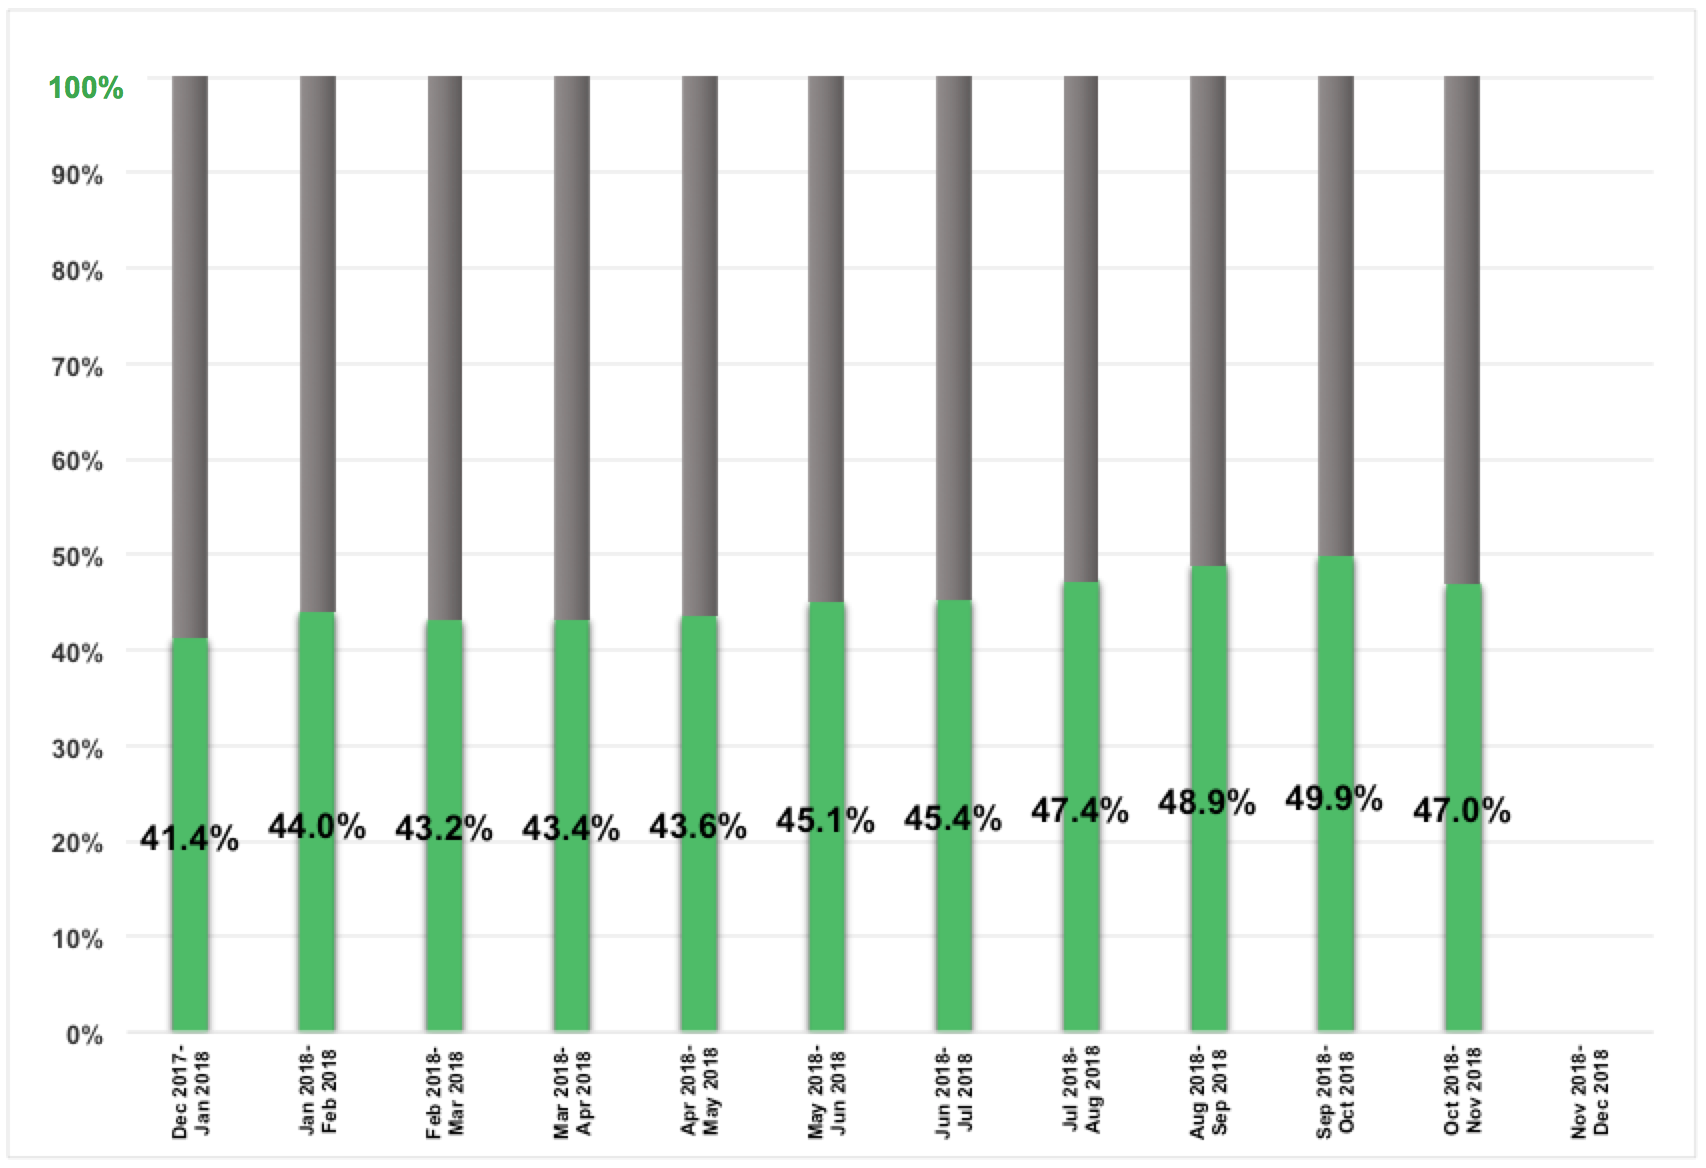
The Monthly Financial Update gives our readers an inside look at the allocation and performance of our personal portfolio. At the beginning of each month, we share a snapshot of our investments and highlight their performance over the previous month. In addition, we compute our progress towards achieving our retirement number.
The Sky Is Falling!
It's been a rough one. The market wiped out almost all of this year's gains in just a single month! How am I responding? With a big fat smile! When I invest, my ultimate goal is to acquire as many income producing, appreciating assets as possible. The assets I'm currently focused on acquiring are shares of S&P 500 and Total Market index funds. The more I can buy, the better. Every time the market falls, my eyes light up because I know I'll be able to afford a larger quantity of these great assets. It's like they are on sale. It's an asset sale!! How about 5% off? No? 10%! 15!? 20! As far as I'm concerned, the steeper the discount the better. I'm not concerned about losing money because money is only lost when you sell, and I never sell. I know that no matter what happens these assets will continue to produce cold hard cash for me each quarter in the form of dividends and I'm also privy to an amazing fact about the stock market. It always goes up!
Results:
-5.84% month over month growth
47.0% of retirement number saved
Check out our performance in the table below.
The Numbers
Accounts Portfolio Allocation Change In Value (October-November)
Liquid Funds 1.00% -28.77%
High-Yield Savings 7.97% 7.90%
REITs 0.92% 2.56%
401(k)s 50.88% -7.53%
IRAs 3.55% -6.20%
HSA 0.58% 3.76%
Cryptocurrencies 0.02% -9.33%
P2P Lending 0.27% 0.46%
Taxable Stock Investments 34.56% -5.32%
Debt 0.24% 53.78%
Total = 100%
Portfolio Allocation = Current asset distribution of our portfolio
Investment Performance = Change in account value due to asset appreciation/depreciation, deposits, and withdrawals
Tools To Get You Started
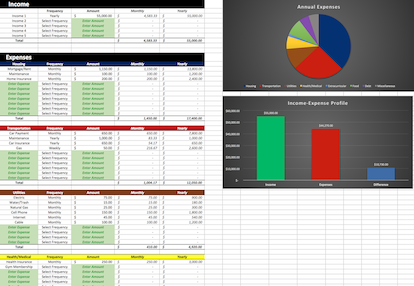
Become a subscriber today, and you’ll receive our Free Financial Planning Dashboard. This tool allows you to enter your income and expenses to create a detailed budget. You can use it to track your spending habits over time or just to get an idea of where your money is going each month. Take a look at the automatically generated charts and you may discover you have a little more cash to invest than you thought.
If you’re interested in detailed instructions on how to budget, save, pay off debt, and invest, check out The 6 Phases of Building Wealth. This book provides step-by-step instructions for working through each “Phase” in the process of achieving Financial Freedom. If you're just starting out, the information in this book will provide you with an invaluable resource. You can pick up the digital version for only $2.99 on Amazon.

Disclosure: Some of the links found on this website may be affiliate links. Affiliate links pay GGD a small commission when you click through and/or make a purchase. This is at zero additional cost to you.
Full Disclaimer/Disclosure
Related Posts
-
Monthly Financial Update - October 1, 2018
The Monthly Financial Update gives our readers an inside look at the allocation and performance of our personal portfolio. At the beginning of each month, we share a snapshot of our investments and highlight their…
-
The Simple Formula I’m Using To Retire In My 30's
Wake up, go to work, spend a few hours with family, go to bed, rinse and repeat. Some form of this routine probably describes the typical day for most of us. Throughout our lives, we’re…
-
The Stock Market Always Goes Up
My first taste of investing came after graduating from college and starting my first “real” job. This initial experience consisted of picking which funds–from a list of 10 or 15–I would invest in, in my…