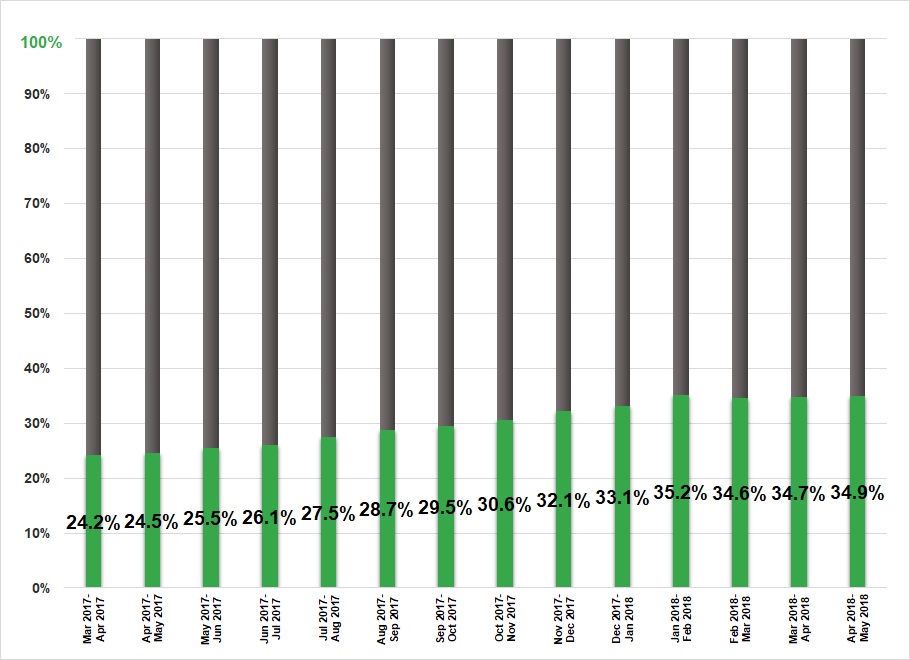
We’ve been doing a lot of traveling this month so we haven’t had the usual amount of time to put together a detailed post. However, it’s important to us that we are consistent in releasing new content, so we thought this week would be the perfect opportunity to share a snapshot of some of our historical performance data, going further back than our previous monthly financial updates. We dug through our archives and compiled data on our net worth going back 1 full year. The chart below shows the result.
It should be noted that in 2017 we were contributing about 55% of our total income to investments while in 2018 we’ve increased that number to about 65-70%. Even though we’ve significantly increased the rate of our investment contributions this year, our month-to-month performance has lagged what we were able to achieve in 2017. So what changed? We didn’t modify our investment strategy or liquidate any of our assets. We also didn’t change our spending habits.
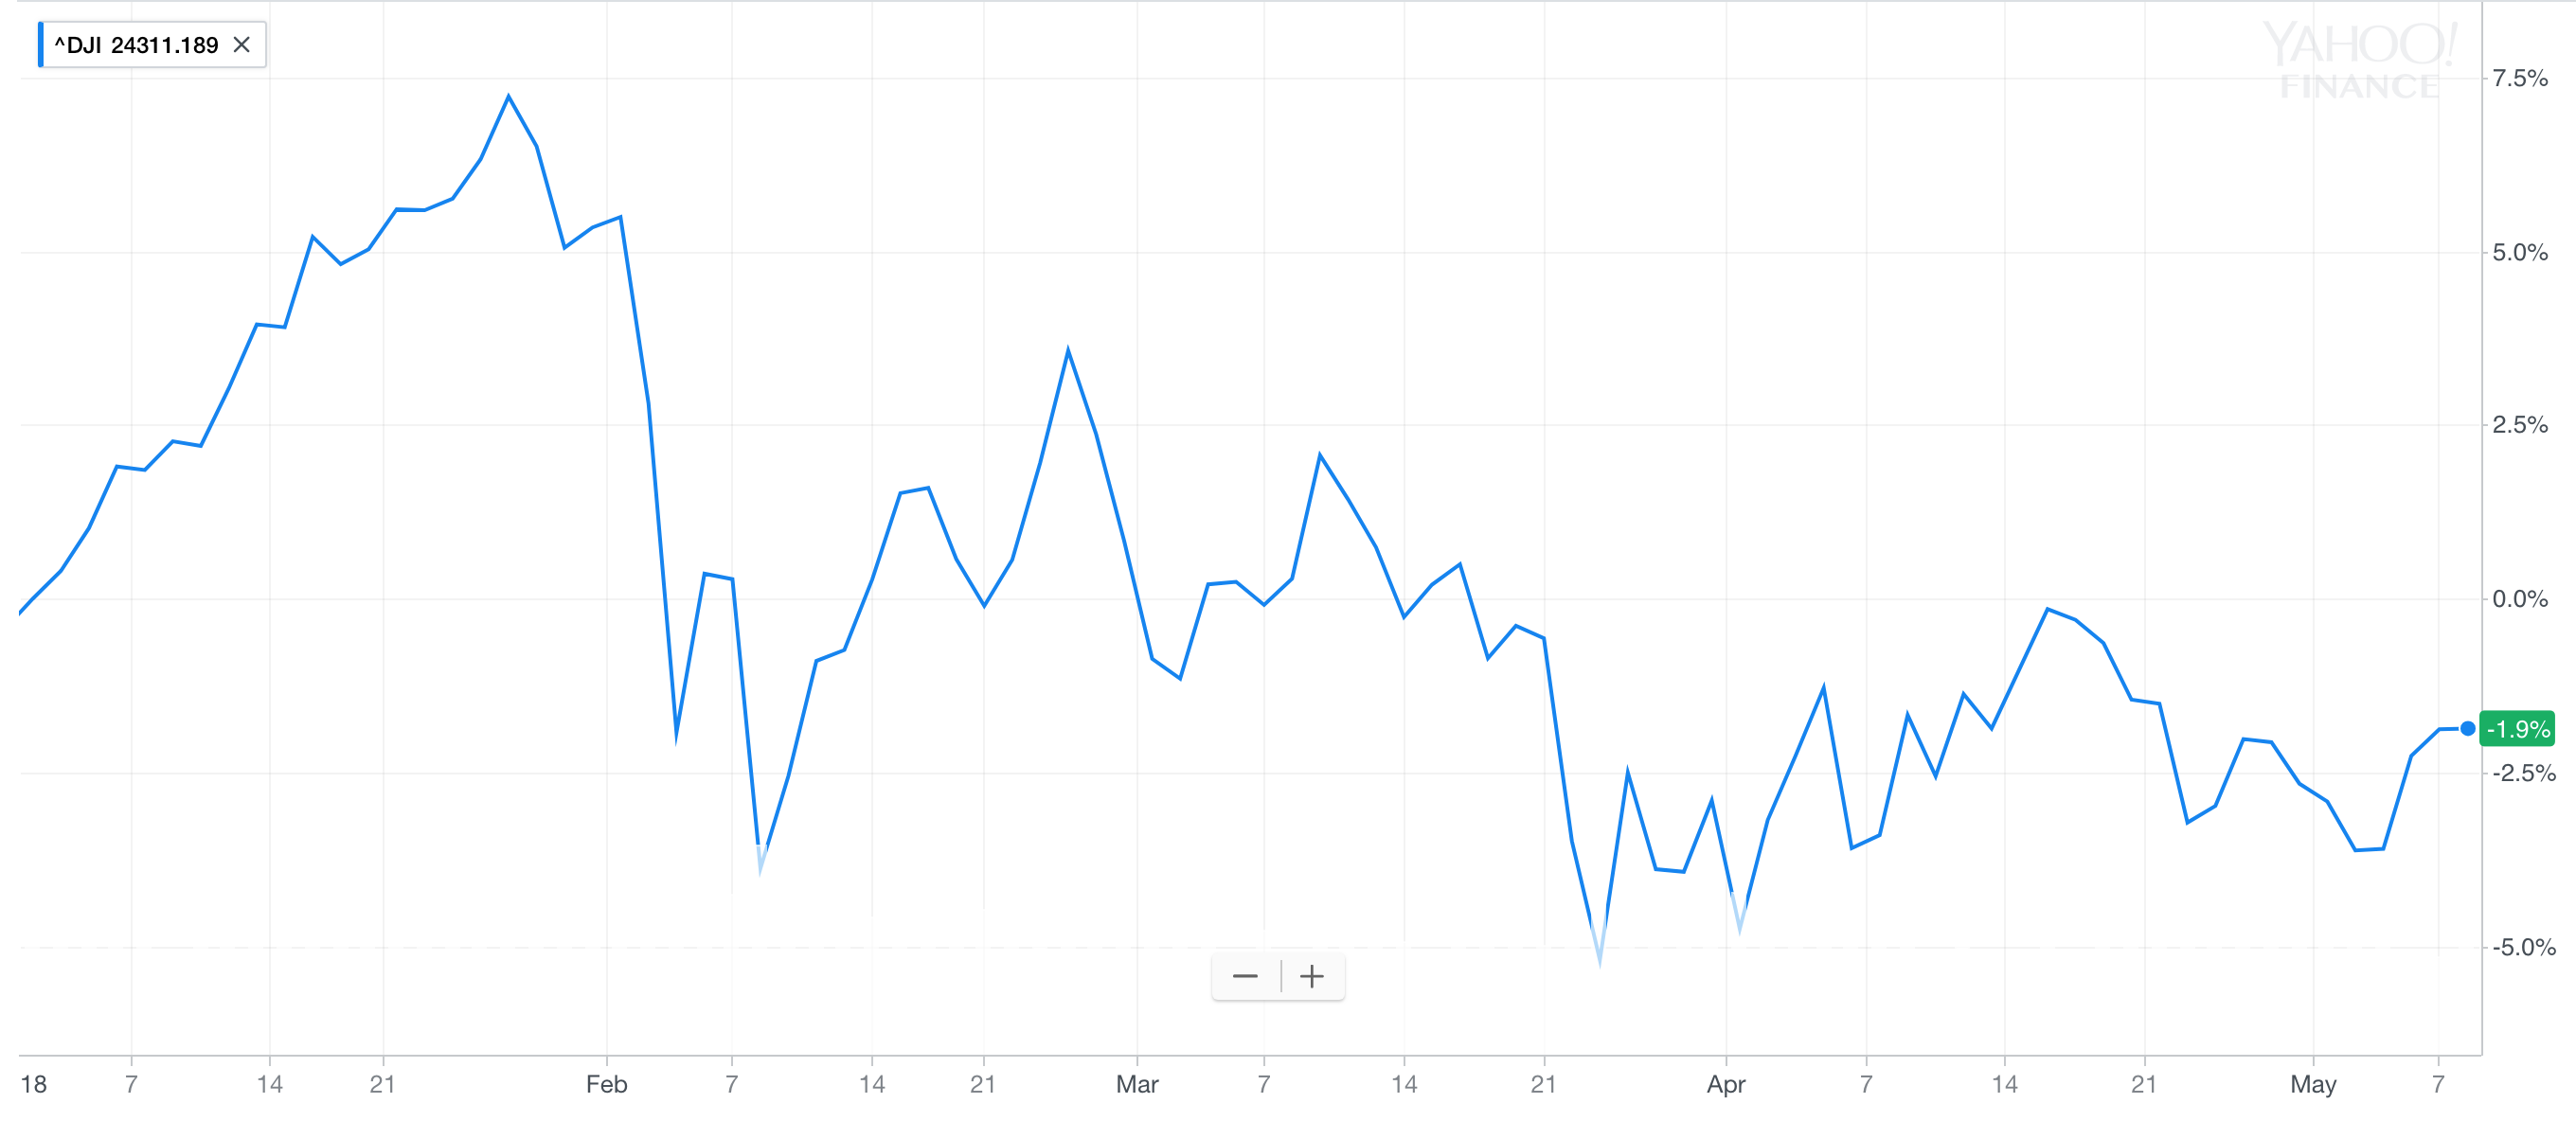
The truth is, the slowdown in the growth of our portfolio can be directly tied to the recent volatility of the stock market.
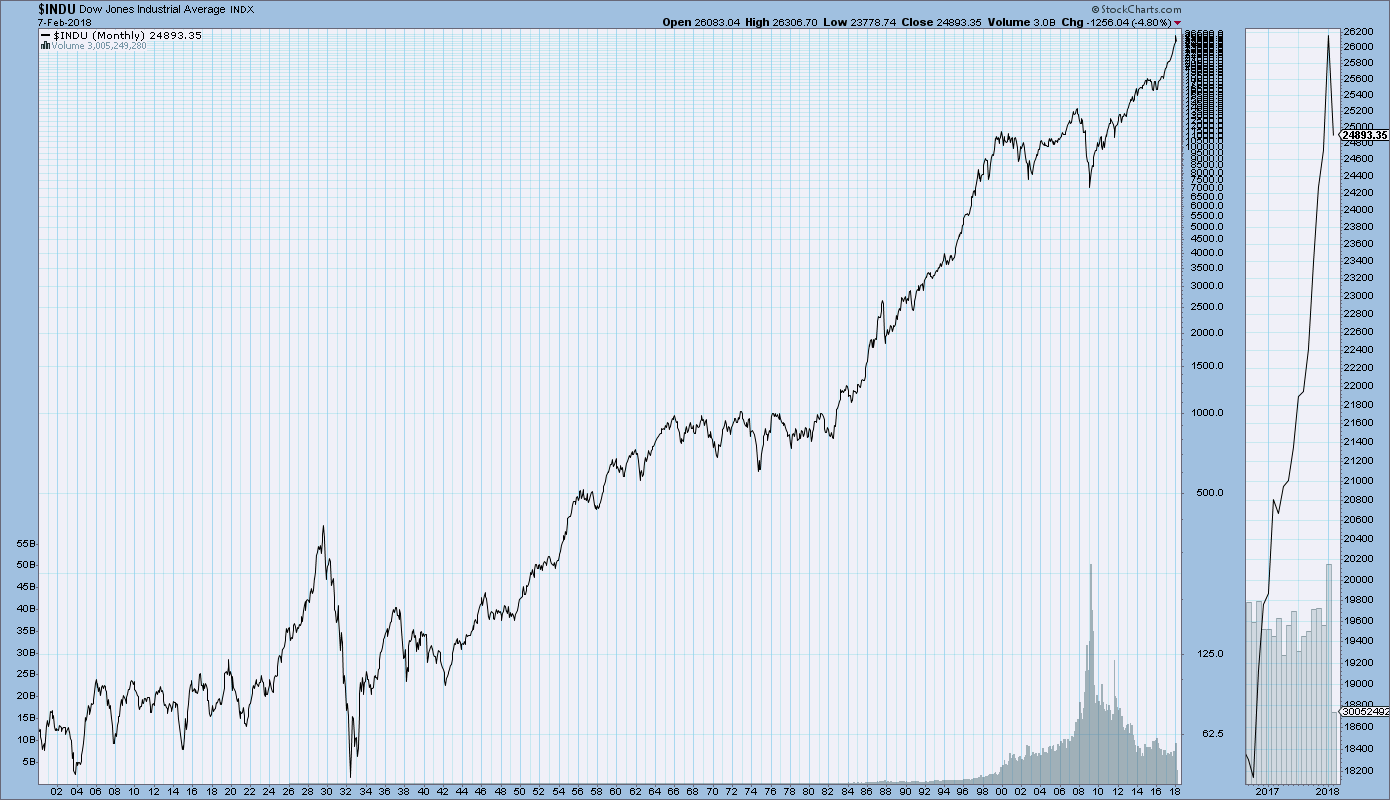
There will always be both ups and downs when you invest. Some months (or years) your portfolio will perform terribly, while others it will grow beyond your expectations. The key to remember is, when you invest over the long-term, it will always go up. In order to take advantage of this growth, all you've got to do is control your fear (i.e don't sell) and keep investing. In 5 or 10 years, when you’re preparing to submit your letter of resignation, you’ll be happy you did.
Stock Market Performance Over 100+ Years
Tools To Get You Started
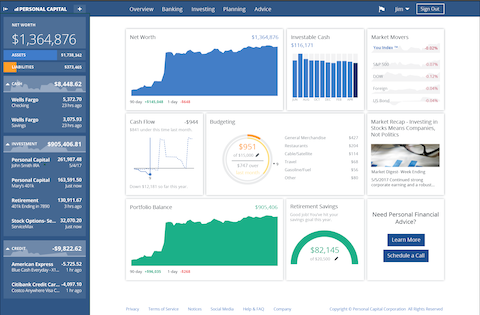
Get a head start on your journey toward achieving financial independence by analyzing and tracking your income, expenses, investment performance, and overall net worth with the free online wealth management tool Personal Capital.
We use Personal Capital regularly to analyze our investment fees, track our investments, and project our net worth. We also periodically review our progress toward retirement with their retirement planning calculator.
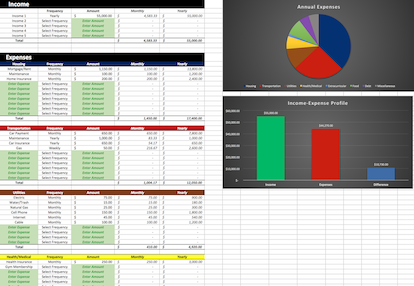
If you’d rather do things on your own, become a subscriber today and you’ll receive our Free Financial Planning Dashboard. This tool allows you to enter your income and expenses to create a detailed budget. You can use it to track your spending habits over time or just to get an idea of where your money is going each month. Take a look at the automatically generated charts and you may discover you have a little more cash to invest than you thought.
If you’re interested in detailed instructions on how to budget, save, pay off debt, and invest, check out The 6 Phases of Building Wealth. This book provides step-by-step instructions for working through each “Phase” in the process of achieving Financial Freedom. If you're just starting out, the information in this book will provide you with an invaluable resource. You can pick up the digital version for only $2.99 on Amazon.
Disclosure: Some of the links found on this website may be affiliate links. Affiliate links pay GGD a small commission when you click through and/or make a purchase. This is at zero additional cost to you.
Full Disclaimer/Disclosure
Related Posts
-
Monthly Financial Update - April 1, 2018
The Monthly Financial Update gives our readers an inside look at the allocation and performance of our personal portfolio. At the beginning of each month, we share a snapshot of our investments and highlight their…
-
Surprisingly Simple Investment Strategy For Retiring Early
The other day, while browsing through YouTube videos, I came across one that featured Tony Robbins discussing investing. I watched the video and found it had some good, if not groundbreaking, suggestions. There was one…
-
Monthly Financial Update - May 1, 2018
The Monthly Financial Update gives our readers an inside look at the allocation and performance of our personal portfolio. At the beginning of each month, we share a snapshot of our investments and highlight their…

