Your Taxes May Be Lower Than You Think

Why Taxes?

I recently had a discussion (debate) with a friend of mine comparing the benefits of pre-tax investments to those of Roth investments. I argued that, while there are many cases where Roth investing would be more advantageous/practical for the average person, pre-tax is usually the best choice mathematically. I presented him with several supporting facts and figures (many of which are mentioned in my post about the greatness of 401(k)s) but we were never able to reach an agreement on which was the better option. I decided, for my next post I would run the numbers and come up with a definitive winner. As I began to put an outline together for the post, I realized I would need to do some detailed tax calculations in order to come to an accurate conclusion.

Typically, when creating an example involving taxes, I simply select a marginal tax rate and apply it across the total income. In reality, however, Federal income taxes don’t work this way. Thinking about this made me realize that most people are probably unfamiliar with exactly how Federal income taxes are calculated. Since knowledge of how income taxes are calculated is crucial to understanding any pre-tax vs. Roth comparison, I decided to temporarily shift gears and write an article explaining our tax system. The pre-tax vs. Roth debate will have to remain unanswered for at least another week. Anyway, on to taxes…

A Progressive System

As you may already know, the United States has a progressive tax system. It is “progressive” in that the tax rate progresses from low to high as income increases. Each portion of your income that falls into a specific range is taxed at a different rate. When someone mentions they fall into the 24% tax bracket, this really means that their last dollar earned puts them within the range of income that is taxed at 24%. Only a portion of their total income will actually be taxed at 24%. Their overall effective tax rate is probably much lower than 24%. Lets do a quick example to better illustrate this concept.

Here are the different tax brackets for 2018.

2018 Tax Brackets

RateSingle FilerMarried Filing JointlyHead Of Household
10%$0-$9,525$0-$19,050$0-$13,600
12%$9,526-$38,700$19,051-$77,400$13,601-$51,800
22%$38,701-$82,500$77,401-$165,000$51,801-$82,500
24%$82,501-$157,500$165,001-$315,000$82,501-$157,500
32%$157,501-$200,000$315,001-$400,000$157,501-$200,00
35%$200,001-$500,000$400,001-$600,000$200,001-$500,000
37%$500,001+$600,001+$500,001+

Example #1

If Mary is unmarried and has an income of $100,000 per year, she will fall into the 24% tax bracket. However, as a result of our progressive tax system, her effective tax rate (the percent of her income she actually pays in taxes) will be significantly lower. Mary’s $100,000 income will be taxed as follows:

The first $9,525 will be taxed at 10%

The next portion of her income—above $9,525, but not $38,700—will be taxed at 12%

The next portion of her income—above $38,700, but not $82,500—will be taxed at 22%

The final portion of her income—above $82,500, but not $157,500—will be taxed at 24%

Now let’s work it all out,

Income Taxed At 10% = $9,525 x 10% = $952.50
Income Taxed At 12% = ($38,700 - $9,525) x 12% = $29,175 x 12% = $3,501
Income Taxed At 22% = ($82,500 - $38,700) x 22% = $43, 800 x 22% = $9,636
Income Taxed At 24% = ($100,000 - $82,500) x 24% = $17,500 x 24% = $4,200

Total Income Taxes Owed = ($952.50 + $3,501 + $9,636 + $4,200) = $18,289.50
Effective Tax Rate = $18,289.50 / $100,000 = 18.29%

Even though her tax bracket is 24%, Mary only owes 18.29% of her income to taxes.

Let’s do an example for married filers.

Example #2

Harry and his wife, Sally, are both self-employed independent contractors. Their total household income for the year was $125,000, putting them in the 22% tax bracket for married filers. As independent contractors, no taxes are taken out of the pay they receive, meaning they are solely responsible for calculating and paying their own taxes. Assuming they file their taxes jointly, how much Federal income tax should they pay?

If Harry and Sally were to calculate their taxes owed using the tax bracket they fall into, they would come up with $27,500 ($125,000 x 22%). But as we’ve discussed, the tax bracket percentage should only be applied to the dollars that fall within its range, not your total income. If Harry and Sally choose to pay $27,500, their tax bill, will, of course, be covered in full, but they would also be giving the government a free loan by overpaying. They would have to wait for their tax return in order to get back the extra money they contributed. Here at GoGreenDollar, we are all about keeping (and investing) as much of our money as we can. Free loans to the government are a no-no. So, how much should Harry and Sally actually pay?

Income Taxed At 10% = $19,050 x 10% = $1,905
Income Taxed At 12% = ($77,400 - $19,050) x 12% = $58,350 x 12% = $7,002
Income Taxed At 22% = ($125,000 - $77,400) x 22% = $47,600 x 22% = $10,472

Total Income Taxes Owed = ($1,905 + $7,002 + $10,472) = $19,379
Effective Tax Rate = $19,379 / $125,000 = 15.50%

Harry and Sally’s effective tax rate is only 15.50%, they owe a total of $19,379 in Federal income taxes for the year. If they had paid solely based on their tax bracket, they would have overpaid by more than $8,000 ($27,500 - $19,379 = $8,121)!

Note: I ignored all tax deductions in the examples above for simplicity, but any deductions (including the standard deduction) would further decrease the effective tax rate.

Final Thoughts

So that’s how federal income taxes are calculated! Not as straight forward as some might have assumed. Maybe your tax rate is a little lower than you thought?

Additional Info: If you’re interested in calculating your own effective tax rate you don't have to do it by hand. Check out this super useful and easy to use Federal Income tax calculator (came in handy for checking my work).

Tools To Get You Started

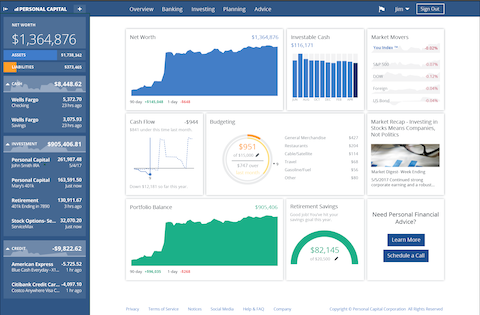
Get a head start on your journey toward achieving financial independence by analyzing and tracking your income, expenses, investment performance, and overall net worth with the free online wealth management tool Personal Capital.

We use Personal Capital regularly to analyze our investment fees, track our investments, and project our net worth. We also periodically review our progress toward retirement with their retirement planning calculator.

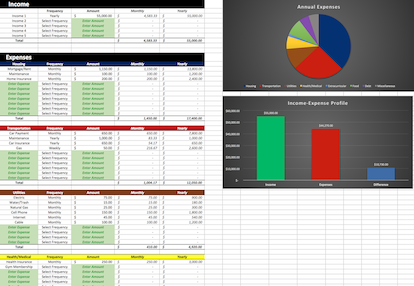
If you’d rather do things on your own, become a subscriber today and you’ll receive our Free Financial Planning Dashboard. This tool allows you to enter your income and expenses to create a detailed budget. You can use it to track your spending habits over time or just to get an idea of where your money is going each month.  Take a look at the automatically generated charts and you may discover you have a little more cash to invest than you thought.

If you’re interested in detailed instructions on how to budget, save, pay off debt, and invest, check out The 6 Phases of Building Wealth. This book provides step-by-step instructions for working through each “Phase” in the process of achieving Financial Freedom. If you're just starting out, the information in this book will provide you with an invaluable resource. You can pick up the digital version for only $2.99 on Amazon.

Disclosure: Some of the links found on this website may be affiliate links. Affiliate links pay GGD a small commission when you click through and/or make a purchase. This is at zero additional cost to you.
Full Disclaimer/Disclosure

JOIN OUR NEWSLETTER
I agree to have my personal information transfered to MailChimp ( more information )
Subscribe today to receive your Free GoGreenDollar Financial Planning Dashboard!
We hate spam. Your email address will not be sold or shared with anyone else.

Posted in Save Green, Taxes and tagged , , , , , , .
Subscribe
Notify of
guest
2 Comments
Oldest
Newest Most Voted
Inline Feedbacks
View all comments
Pamela Griffin

My Goodness! I definitely did not know this! Thank you for the tax lesson!